
I am worried that externally caused vibrations might damage my HDDs (NAS in the planning). The subway / metro runs under my building, and every time the train passes, this causes slight but measurable vibrations in the 50-100 Hz frequency range. It is more like a rumbling noise than the usual vibration of a passing train.
I’ve been researching the topic of vibration dampening on and off, and things like sorbothane popped up in my search. I also remember finding foam plates in an eye scorching yellow material.
My plan is to set up the case, fire up a measuring app on my phone (say phybox or the like) and test a few options. But I figured, I can’t be the first person to be guarding against outside vibrations. :D
Other than the usual 3-2-1 and backup regularly, what can I actually do? I would like to make sure that the lifespan of the HDDs doesn’t get too negatively impacted, so the chances of a catastrophic failure, as well as having to invest 1k EUR every couple of years is reduced as much as possible. Thanks!
I work in railway noise and vibration mitigation, and @scrion@lemmy.world has given you a great starting point. When we build rails and want to mitigate ground-borne noise and vibration (typically up to ~200 Hz), we generally mount the rails on soft pads and add extra mass to isolate the rails from the surroundings. The exact same approach will work at your computer. We don’t typically use tuned mass dampers for ground-borne vibration, so I think that will be overkill for you, but you can try if you like.
I wanted to suggest that, in addition to the feet/foam/plywood, you can also add a big chunk of something heavy to help with isolation. Like put a heavy rock on top of the foam, and your computer on the rock. The trick is this: if k is the stiffness of your foam, and m is the mass of everything on top of the foam, then your isolating frequency is at √(2k/m). All frequencies above the isolating frequency will by mitigated (the further above, the more they’re mitigated), while all frequencies below will be amplified.
(Quick aside if you actually want to calculate frequency with √(2k/m): check that your units for k and m are compatible, you should end up with a result in units of 1/s, which is actually radians per second, then multiply by 2π radians per cycle to convert to Hertz).
When it comes to measuring results, since your problem is in low frequencies, you can probably use your phone’s accelerometer assuming it reads fast enough (the sample rate must be at least double the highest frequency you care about). Mount it as rigidly as you can to your computer, since if the connection is soft, the phone will be in its own isolating system. The quickest way to test your isolator would be to hit close to the base with a hammer; impacts excite a wide range of frequencies equally, so in the frequency domain you should see vibration amplitudes following a shape something like these.
But as @scrion@lemmy.world notes below, you don’t really care about your isolator’s response, you care about what trains are doing to your computer. However, he said one thing I disagree with: it’s not the amplitude of the acceleration that you care about, it’s the amplitude of energy, and therefore velocity. This article gives a good introduction to ways you could analyze that. But now we’re getting way in to the weeds on what should be a simple project!
One last aside: if the vibrations in your building are bad enough, you could raise it as an issue with the metro operator. The US Federal Transit Administration sets standards that are commonly followed even outside of the US (see Table 8-1 in their Noise and Vibration Manual); if your measurements show vibration exceeding those limits then they might pay me to fix it :D.
Hey, great that you chimed in, I agree with the points you’re making. As for my remark regarding amplitude, what I wanted to convey was: in the measurement scenario using the PhyBox smartphone app, OP should see an overall smaller signal envelope if the NAS was properly decoupled, compared to the previous plot.
As for your comment regarding the Nyquist theorem, PhyBox maintains a list of devices and their sensors so it would be possible to lookup the available sampling frequency. There are other factors potentially limiting the sample rate (e. g. switching offl microphone access for the app on Android), but it’s a good starting point.
https://phyphox.org/sensordb/
However, I think we agree this should be solvable without much theoretical effort.
Wow, I hadn’t heard of phyphox before (hadn’t even noticed @khorak@lemmy.dbzer0.com mentioned it in the OP). That’s very cool and I’ve installed it now.
I’m wondering, now that you’ve seen the app, do you have some practical advice on how to measure the difference without having to spend a few hours researching and refreshing on high school physics? It seems that my only option is to run the “Acceleration without g” experiment and work on the csv export.
A probably naive approach would be to filter out values below a certain threshold (a ‘low pass filter’ of sorts to deal with a noisy sensor) and then try to meaningfully sum the acceleration by time period. But just as I wrote this I realized that I can’t simply sum a few values from several rows and call it a day.
The article you linked explained the idea behind the pseudo velocity well, I’m wondering if I can… “sum the area” (assuming interpolated data) under the various measurement points. Without completely nerding out and investing too much time :D My sensor seems to have a rate of 200Hz, so it should be good for measuring vibrations up to 100Hz.
Edit, it’s integrals, right? This is actually exciting, haven’t touched math since university. Also here’s an example of how the acceleration graph looks like when the phone is on the heating / radiator (more or less worst case):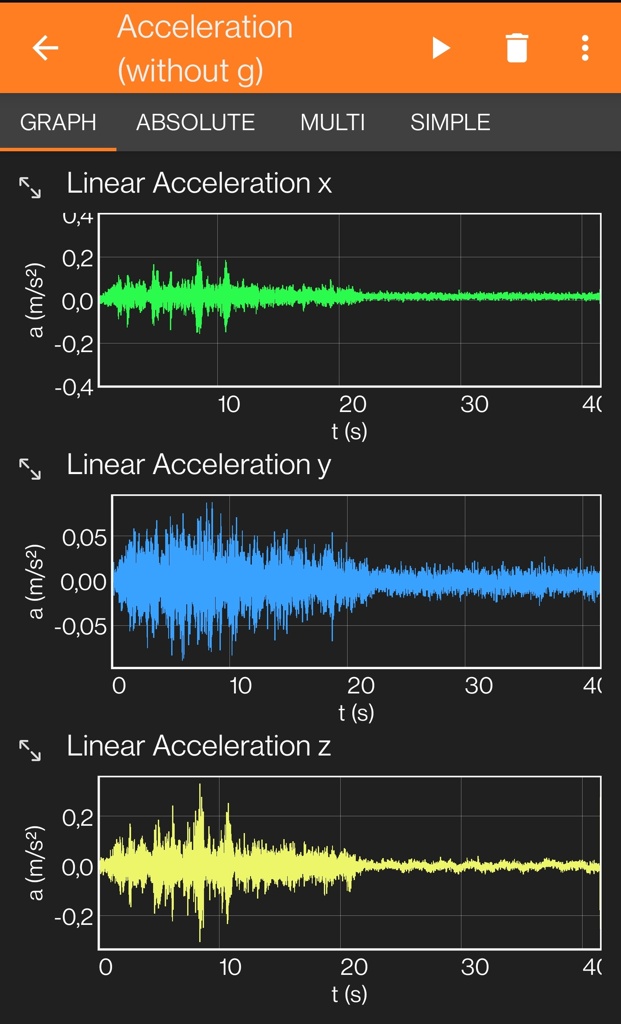
None of the included experiments look to be exactly what you need. For characterizing your isolator, the included Acceleration Spectrum is close, though it records continuously, making it difficult to use to record impact response. For evaluating actual train vibrations, the user-defined Integrated Acceleration might be a start, but it doesn’t include the filtering needed to get good information. You could define your own experiments, but that’s probably even harder than analyzing the CSV data on your computer. At least on your computer you can change your analysis freely and immediately see results, rather than re-running the experiment every time.