
Droppped in to post this. Thank you.
Beat me to it
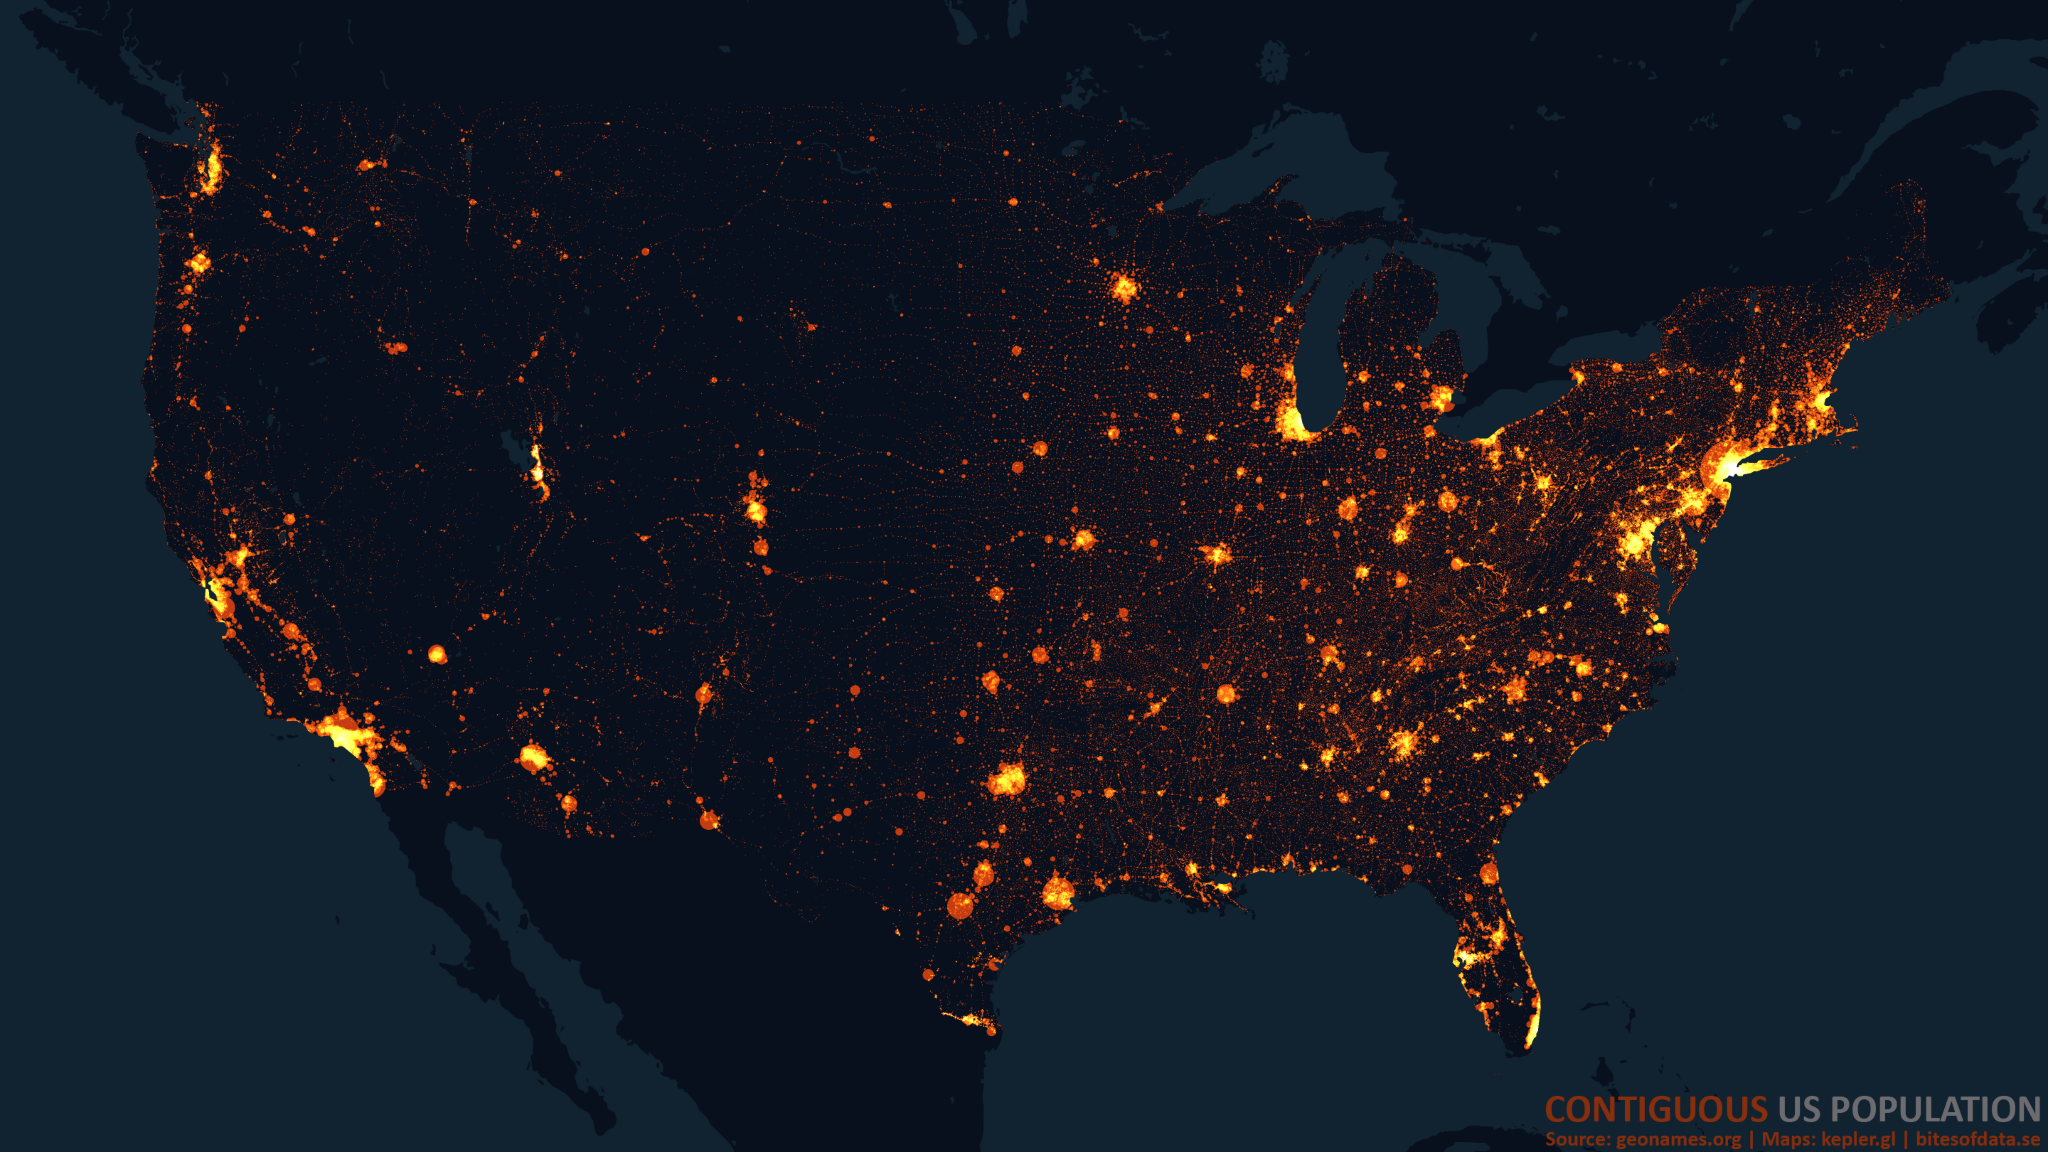
Population map of the US
I conclude that people are attracted to furries
Also, all Americans are furry and so, attracted to each other and either viewing or being viewed as the big foot
But how does the little spoon factor into all this? Is it being stepped on by the “big foot” like a Lego, or are there other factors at play?
omg this is big brain. Higher population density means higher amount of Bigfoot sightings and furry suits, which means both could be uncorrelated.
oh no … I realized this is just statistics 101
Now normalize it for population density.
How does that work? Im not a stat person.
There are a number of normalization algorithms. Easiest would be to just divide by the area’s population count. That gives you the relative number of bigfoot sightings or fursuits per capita, removing any skews introduced by varyin population size.
Say you have two areas:
Area 1: 100000 people, 1000 fursuits, 500 bigfoot sightings Area 2: 1000 people, 10 fursuits, 5 bigfoot sightings
Without knowing the population size, it looks like more fursuits means more bigfoot sightings. But if we divide by the population size, we get 0.01 fursuits and 0.005 bigfoot sightings per person in both areas.
Hope that helps. ^^
Simple normalization does amplify signals in low density areas. If a person in a tiny town of 100 reports a bigfoot sighting and another person in an area with 10,000 population also reports a sighting, then with simple normalization the map would show the area with 100 people having 100 times as many big foot sightings per capita as the area with the population of 10k. Someone casually reading the map would erroneously conclude that the tiny town is a bigfoot hotspot and would in general conclude bigfoot clearly prefers rural areas where they can hide in seclusion. When the reality is that the intense signals are artifacts of the sampling/processing methods and both areas have the same number of fursuit wearers.
That’s the point. To make the low-population area more intense. Because relative to the population density, there were 100 times as many sightings. Or what am I missing.
I’m not saying normalization is a bad strategy, just that it, like any other processing technique comes with limitations and requires extra attention to avoid incorrect conclusions when interpreting the results.
Because relative to the population density, there were 100 times as many sightings. Or what am I missing.
If you were to attempt to trap and tag bigfoots in both areas, would you end up with 100 times as many angry people in a gorilla suit in the small town? No. You would end up with 1 in both areas. So while the tiny town does technically have 100x the density per capita, each region has only one observable suit wearer.
Assuming the distribution of gorilla suit wearers is uniform, you would expect approximately 99 tiny towns with no big foot sightings for every 1 town with a sighting. So if you were to sample random small towns, because the map says big foots live near small towns, you would actually see fewer hairy beasts than your peer who decided to sample areas with higher population density.
If we could have fractional observations, then all this would be a lot more straightforward, but the discrete nature of the subject matter makes the data imherently noisy. Interpreting data involving discrete events is a whole art and usually involves a lot of filtering.
Ah, I understand now, thank you!
I like how it’s relevant not just because they’re both about population maps, but also because they’re both about furries.
Good to know that all fursuit owners are being tracked 24/7 via satellite.
They’re just tracking IT data centers as a proxy.
So Bigfoot can’t cross over the border to Mexico?
Wouldn’t be allowed back in. I don’t think Bigfoot’s ever been formally nationalized. Gets back to the border from his Mexican sojourn and is told he can’t re-enter legally.
Mexico respects Bigfoot’s privacy.
Really Iowa? Is Bigfoot hiding amongst corn now?
I just can’t believe that in this day and age people still believe in Bigfoot. It’s obviously just a Yeti in a gorilla suit.
no, it’s a gorilla in a gorilla suit in a yeti suit in a gorilla suit
There is one fursuit owner being detained at Guantanamo. The CIA and FBI have neither confirmed nor denied whether said person fights the torturers by shouting “HARDER, DADDY”
Yep


